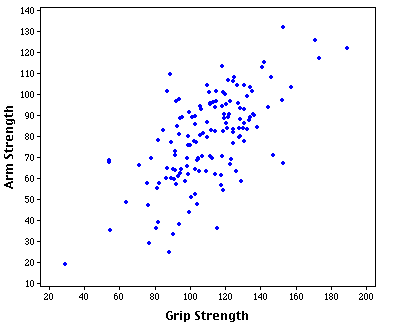
This is an example of a Scatter Plot. This graph is useful in creating relationships between two variables. This graph illustrates the relationship between grip strength and arm-strength for 147 people who are involved in physically demanding jobs. This graph does not appear to have a strong linear relationship as shown by the many outliers.
No comments:
Post a Comment