This is an example of a Univariate Choropleth Map. This example illustrates Raw Civil Liberties score. These types are maps are used when objects need to be classified one at a time. These objects may need to be classified individually because when they are put next to something else they have multiple attributes rendering them incomparable.
Monday, April 27, 2009
Univariate Choropleth Map
This is an example of a Univariate Choropleth Map. This example illustrates Raw Civil Liberties score. These types are maps are used when objects need to be classified one at a time. These objects may need to be classified individually because when they are put next to something else they have multiple attributes rendering them incomparable.
Cartographic Animation
Nominal Area Choropleth Map
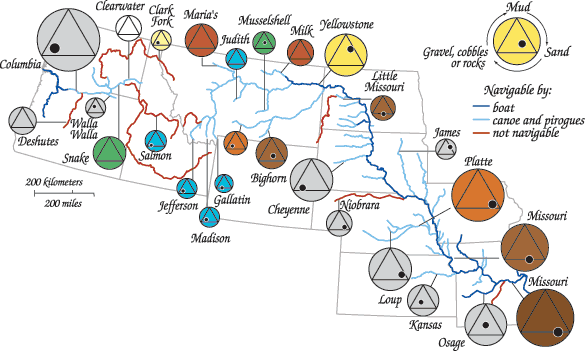
Continuously Variable Proportion Circle Map
Public Land Survey System (PLSS) Map
Cadastral Map
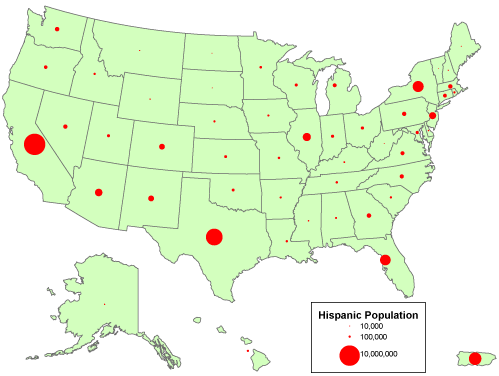
Proportional Circle Map
Propaganda Map
This is an example of a Propaganda Map. This example illustrates Germany as a weak military state surrounded by strong military states. Looking at the map, the message trying to be conveyed that Germany is militarily weak can be shown by all of the other artillery being aimed at Germany which is empty.
Statistical Map
This is an example of a statistical map. This example is of Napoleon’s Russian campaign of 1812. A statistical map is very useful in giving a standard statistic of the functional time course over a specified set of periods. According to this graph the lines shown represent the sizes of Napoleon’s army over a given period of time.
Flow Map
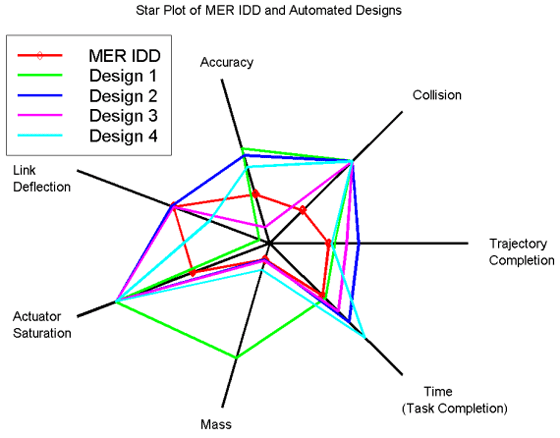
Star Plot
Correlation Matrix
This is an example of a Correlation Matrix. This example is a calculated protein correlation matrix for phage T7. According to this graph more similar info is shown in red while dissimilar info is shown in blue. Many methods of multivariate statistical analysis rely on a correlation matrix as the initial data.
Similarity Matrix
This is an example of a Similarity Matrix. This example is of a Genetic Similarity Matrix among 33 cannabis accessions. This type of graph illustrates a matrix of scores which express the similarity between two data points. For these types of graphs higher scores are given to more similar characters while more dissimilar characters are given lower scores.
Stem and Leaf Plots
This is an example of a stem and leaf plot. This example is of new housing starts in the U.S.. This type of graph is useful in presenting quantitative date in a graphical format. A basic stem and leaf plot is composed of two columns separated by a vertical line. The column on the left is the stem and the column on the right is the leaf
Boxplot
Histogram
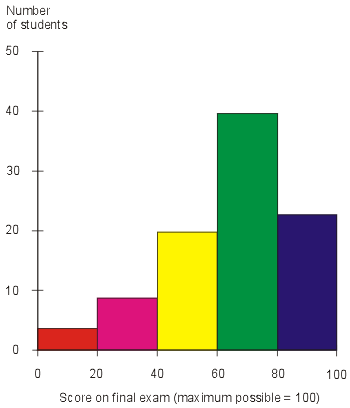
This is an example of a Histogram. The example shown is of results from a test given to theoretical students. The categories are usually specified as non-overlapping intervals of some variable. In this example each interval is illustrated by a different bar color and represents a different score range.
Parallel Coordinate Graph
Triangular Plot
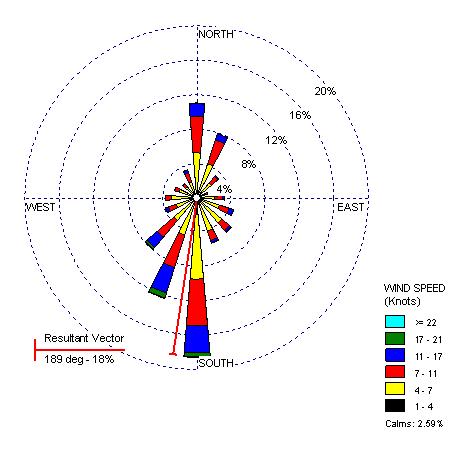
Windrose
Climograph
Subscribe to:
Posts (Atom)